This case study was written by Liane Kober, in collaboration with SciNote and Gilson. Kober is a Scientific Project Assistant in Molecular Biotechnology and Functional Genomics at the Technical University of Applied Sciences in Wildau, Germany.
If you think about research, you generally make associations with innovation and great new things that are developed, always up to date with the equipment and laboratory organization. While attending a congress that was dealing with the smart laboratory of the future, I realized that our university and research departments were far away from the current state of the art lab tools and products. ELNs, namely electronic laboratory notebooks, have been introduced in large companies several years ago, whereas I had heard the term for the first time only a few months ago when the head of our department approached me and asked if I was interested in testing new equipment and workflow within my research project. A colleague of mine - skilled in mass spectrometry - was asked as well. Both of us agreed, although we only had about six weeks to establish the digitalized workflow. So, within two weeks we got accounts for the ELN SciNote, received Gilson’s TRACKMAN® Connected pipetting system and completed two remote trainings. We said goodbye to our paper lab notebooks and took our first steps toward a digitalized laboratory.
SciNote and Gilson TRACKMAN Connected
Before we take a look at our new workflow, let me explain the particularities of the ELN and the pipetting system, respectively. An ELN is an online platform, on which a group of scientists can work together on projects, write and share protocols, plan experiments and store all data in one place.
ELNs are structured in multiple layers to keep your data organized. Within SciNote, there are four main layers: team, projects, experiments, and tasks. In the beginning, a team is defined, consisting of different researchers. Those researchers can create projects, and within those projects, individual experiments are created that consist of multiple tasks.
Each task has its own protocol, which can be self-written or imported from protocols.io - a collection of freely available protocols. For each task, you can set start and due dates, add comments, and assign them as completed. Besides that, you can add the results of a completed protocol directly to the respective task.
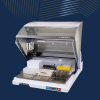
How it Works: TRACKMAN Connected Overview
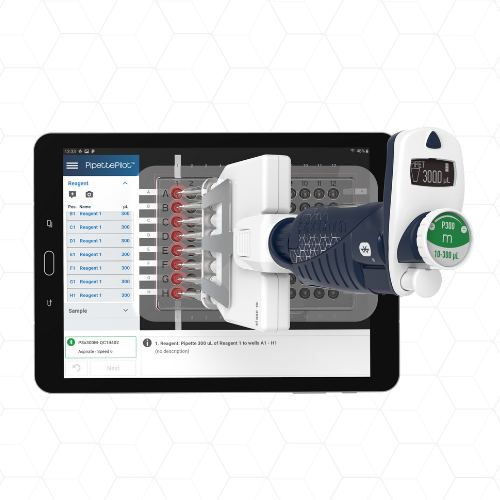
TRACKMAN Connected is a tablet with accessories and apps that makes pipetting on microplates faster with greater traceability and reproducibility.
Watch More Videos
Further integrated functions include:
- Inventories that can be assigned to tasks
- Activity lists to track changes made within SciNote
- Generation of reports to summarize your experiment(s) and results
- Manuscript writer add-on to create a draft of a manuscript
By using an ELN, we have significantly more functionalities available compared to a paper lab notebook. Those are even further extended when we take the Gilson TRACKMAN Connected into account.
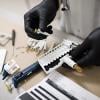
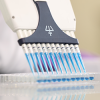
The Gilson system consists of a tablet with accessories that can be paired to Bluetooth®-connected pipettes. The tablet is used to create pipetting plans with defined volumes and positions in a selected format (e. g. 96 or 384 wells). A microtiter plate (MTP) can be directly attached onto the screen of the tablet. The pipettes are connected via Bluetooth, and after that the pipetting is performed almost automatically. The only task the researcher needs to complete is to set the pipette at the right position and click a button. Pipetting is visually and acoustically assisted by marking the pipetting spot through the transparent bottom of an MTP and making a sound at the end of the pipetting step. Additionally, multi-dispensing and automated mixing is possible. After the pipetting is finished, a pipetting report is created that shows all experimental details. The plans and reports can be directly uploaded to SciNote.
Goodbye paper, hello digitalization
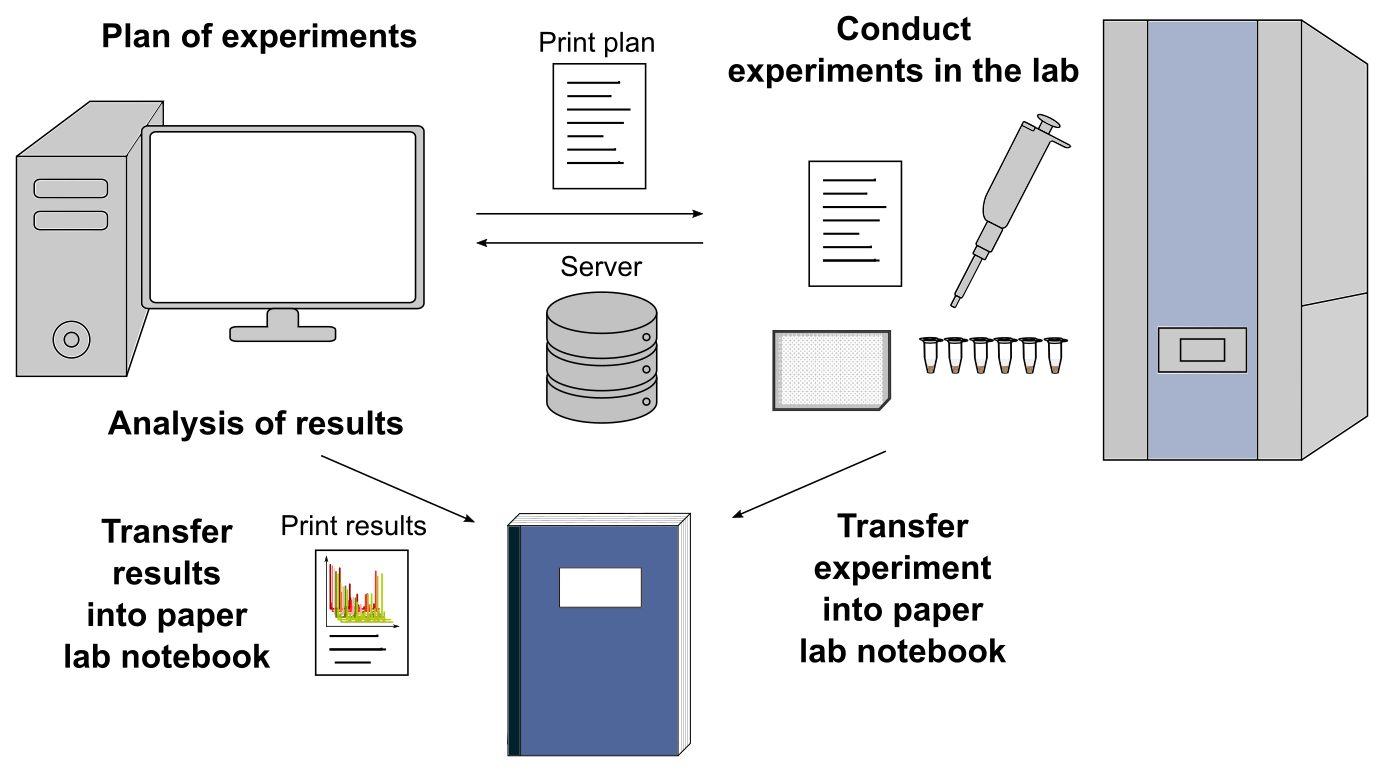
Usually, research in our lab is conducted as follows:
- Plan of experiments on the PC
- Print the plan on a A4 sheet and go into the lab
- Conduct the experiment based on the A4 sheet and save results on an internal server / USB stick
- Transfer experimental execution into the paper lab notebook
- Analyze results on the PC
- Print pictures/tables on an A4 sheet and stick them into the paper lab notebook
After that, we start right from the beginning again. Usually, this workflow is conducted by one person in our lab, who is sometimes assisted by students (with their own PC and paper lab notebook). As a result, only the owner of the PC and the paper lab notebook have direct access to the protocols and results. That’s why it is difficult to monitor experiments by supervisors.
Figure 1. Standard workflow in our laboratory. A printed experimental plan is used in the laboratory. In the end experiment execution and printed results are transferred into a paper lab notebook.
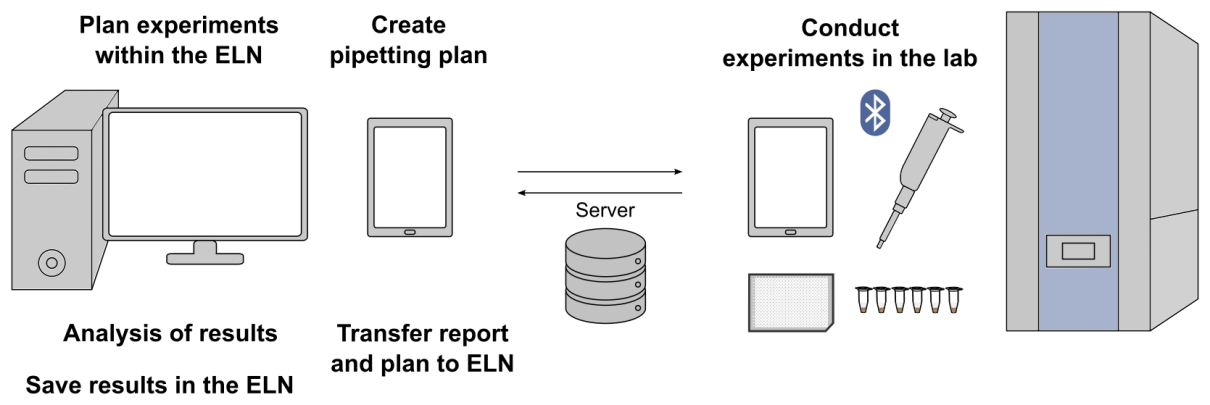
With SciNote, TRACKMAN Connected, and connected pipettes, the workflow has changed at various points:
- Experiments are planned within the ELN
- Additionally, pipetting plans are created on the TRACKMAN Connected tablet
- In the lab, pipettes are connected to the tablet and pipetting is performed almost automatically
- Pipetting plans and reports, as well as analyzed results, are saved within the ELN
- Nothing is printed on paper
- All members of a selected group have access to everything
Figure 2. Digitalization of the workflow in our laboratory. The paper lab notebook and conventional pipetting are replaced by an ELN, a tablet and Bluetooth connected pipettes.
A brief outline of the research objective
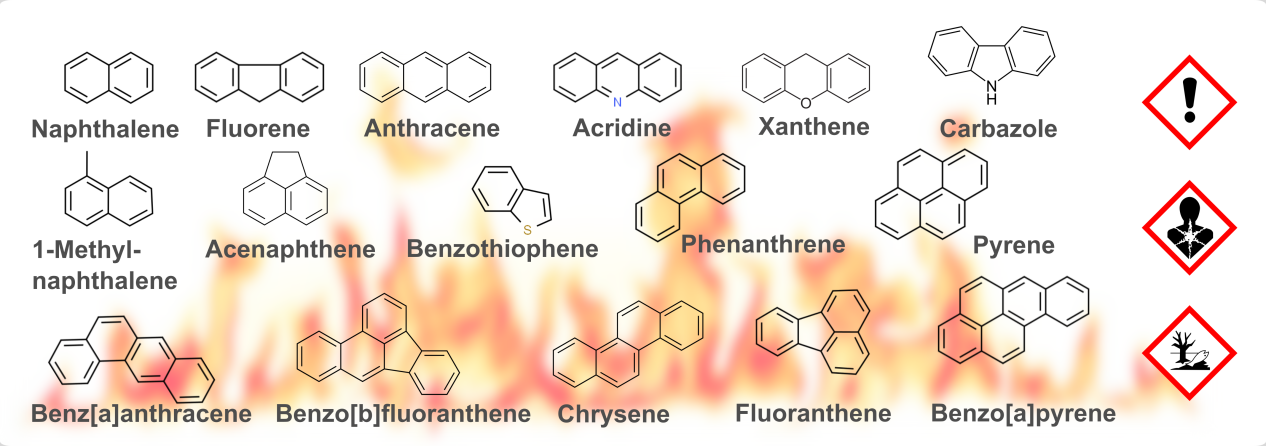
The research in our department is widely diversified within the areas of food, health, and environment. One goal within the latter area is the establishment of new analytical methods for the investigation of environmental toxins as polycyclic aromatic compounds (PAC). PAC is a collective term for polycyclic aromatic hydrocarbons (PAH) and heterocyclic aromatic compounds including N, S, or O heteroatoms (NSO-HET). For this purpose we use MALDI-TOF mass spectrometry - a method which is primarily used for much bigger molecules. Nevertheless, it offers several advantages for the high throughput analysis of many samples. Thus, we wanted to write and test several protocols for the analysis of PAC and compare the results with LC-MS/MS, which is frequently used for the analysis of small molecules.
Figure 3. Structures of investigated polycyclic aromatic hydrocarbons (PAH) and NSO heterocyclic compounds (NSO-HET).
Executing the research
We created a “PAC analysis” team and projects for individual tasks (e. g. Characterization, LC-MS/MS, MALDI-TOF MS). To get to know the system, we decided to make a simple UV/Vis characterization of 16 different standards within two 96-well microtiter plates (MTP). So, we created a protocol within the ELN and linked it to a task in the experiment “UV/Vis spectroscopy” and the project “Characterization.”
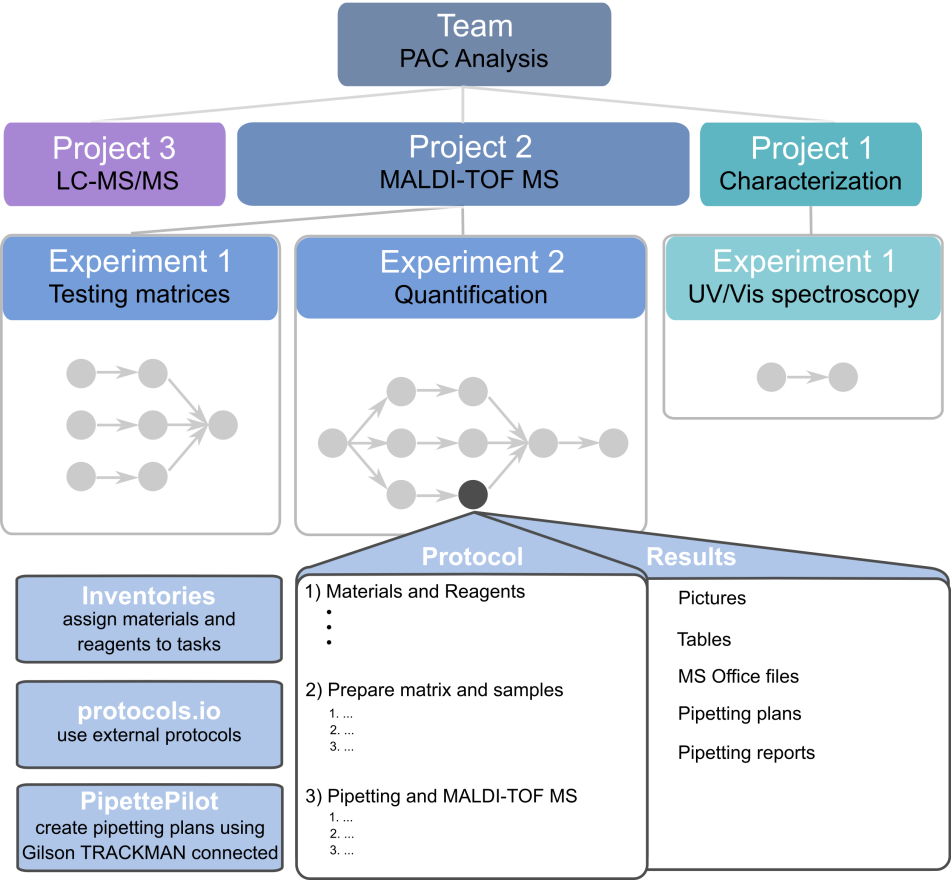
Figure 4. Overview of the project organization within SciNote for the analysis of PAC
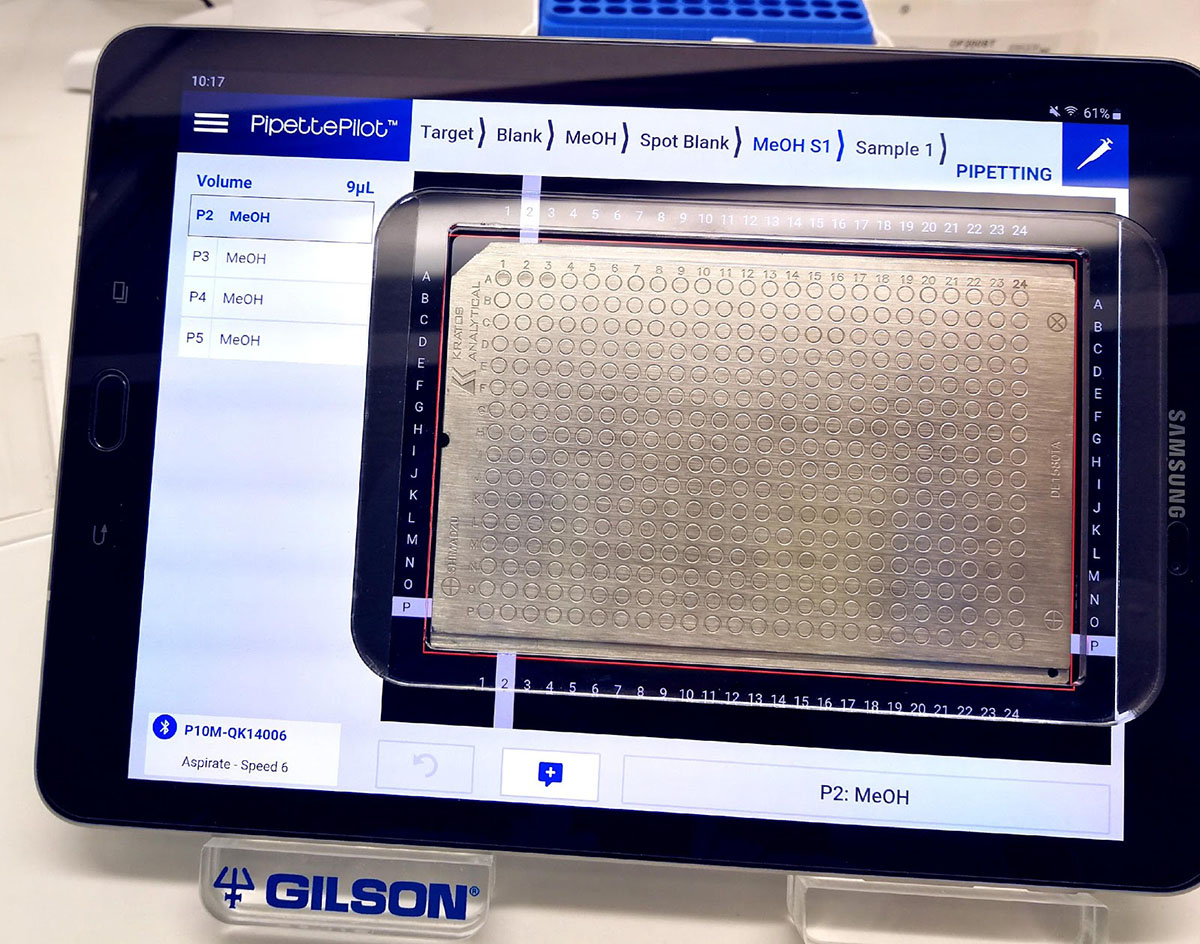
I dealt with the MALDI-TOF MS of PAC and created three experiments for testing matrices, optimizing the matrix composition, and performing a quantification. The creation of inventory lists, planning of the experiments, and writing of protocols within SciNote was intuitive, so I didn’t have much to struggle with there. I was grateful for the opportunity to organize my lab work much better compared to the previous workflow. For the Gilson pipetting system, I wasn’t sure at first, if it suited my research objective. I normally apply my samples on a stainless-steel target with 384 spots for the MALDI-TOF MS. Hence, the actual pipetting spot is not clearly visible compared to a transparent MTP. In spite of that, I used the system constantly for all tasks within my experiments. The creation of pipetting plans on the tablet took some time (around30 min).
However, if the general construct of pipetting was programmed, only small changes to existing plans had to be made to conduct new experiments. This was accomplished quickly, in just a few minutes. Contrary to my initial expectations, the assisted pipetting proved to be very helpful for three main reasons:
- The name of the actual pipetting spot (e.g. P2) was displayed on the target, when before I had to look it up on my A4 sheet and to keep in mind which steps I had already completed.
- The column and row were highlighted, which made it easier to find the actual spot within the 384-well format.
- The spotting of triplicates was simplified through the multi-dispense option of the pipettes. Thus, addition of matrix to the sample, mixing and spotting could be done with one tip for each sample.
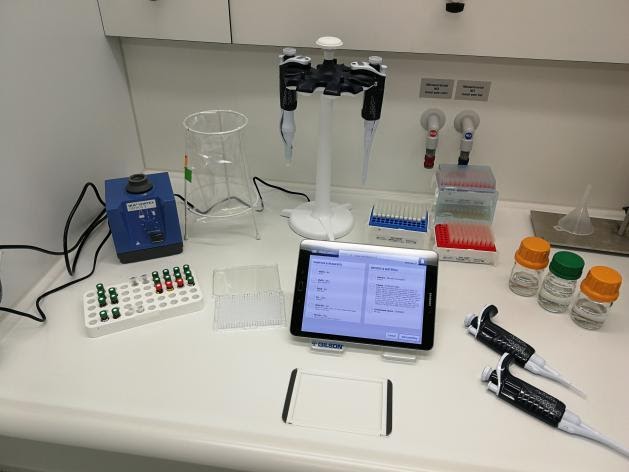
Figure 5. Experimental setup with the Gilson TRACKMAN connected for the MALDI-TOF MS of PAC (left). All steps and spots are indicated on the tablet to facilitate the pipetting (right).
After the pipetting was completed, I submitted the target to the MALDI-TOF MS. The spectra was saved on a local server. I analyzed the results and saved them, along with the pipetting plans, in SciNote. This meant that everything was saved in one place and it was also accessible by my research colleague who dealt with the LC-MS/MS.
Standard vs. digitalized workflow
Finally, I also wanted to know how much time and consumables I would save with the new workflow.
For that reason, I created a small experiment to test the reproducibility of my method and conducted the experiment two separate times. One time with the old standard workflow and the other time using the new system (table 2).
The writing of the protocol within SciNote was a bit faster compared to a standard text document, due to the pre-structured steps and there was no need to print the protocol in the end. However, the additional creation of a pipetting plan increased the total amount of time prior to the experiment. On the other hand, the setup in the laboratory and the pipetting itself were faster compared to the standard workflow. Even more, the recording of the experimental execution and some (!) results in the paper lab notebook took much more time compared to the digitalized workflow. Here all results were uploaded and commented within a few minutes. Finally, it’s important to note that the digitalized workflow is a step toward sustainability because no paper sheets and fewer consumables were needed.
|
Standard workflow |
Digitalized workflow |
| Protocol |
17 min |
33 min (ELN: 13 min, Pip. Plan: 20 min) |
| Experimental setup |
14 min |
9 min |
| Pipetting |
27 min |
19 min |
| Analysis of results |
1 h |
1 h |
| Laboratory notebook |
37 min (exp. execution, some results) |
5 min (comments, all results) |
| Consumables |
24 tubes (matrix + mixing), 53 tips |
3 tubes (matrix), 21/384 wells of a MTP (mixing), 28 tips |
| Paper (A4) |
3.5 sheets (2 printed, 1.5 pages lab notebook) |
none |
Table 1: Comparison of the standard and the digitalized workflow for a selected protocol
Findings of the short-term project
After one month, my colleagues and I drew our first conclusion. While the setup of pipetting plans on the tablet took a little longer, we did save a significant amount of time on pipetting in general, which is a clear benefit.
We noted several significant advantages of the whole setup:
- Better organization of data: everything is saved in one place (protocols, experiments, results) and linked to each other
- Data accessibility by all team members anywhere, at anytime
- Additional data, including environmental characteristics such as temperature, humidity and pressure, is generated and saved making it easier to identify systematic errors
- Easier and faster pipetting with standardized protocols
- Increased sustainability: after one month we saved about 750 A4 sheets
- Accessibility for academia: there is a free version of SciNote available with 1 GB of storage capacity
Digitalization has definitely been incorporated into our laboratories. My colleagues and I will be saying goodbye for good to our paper lab notebooks. We will continue to use SciNote and the TRACKMAN Connected pipetting system, as it is well-suited for our research (e. g. pipetting of a MTP or a MALDI-TOF MS target). Digitalization is on the rise in industry and it’s time we start using it in academia, and beyond.
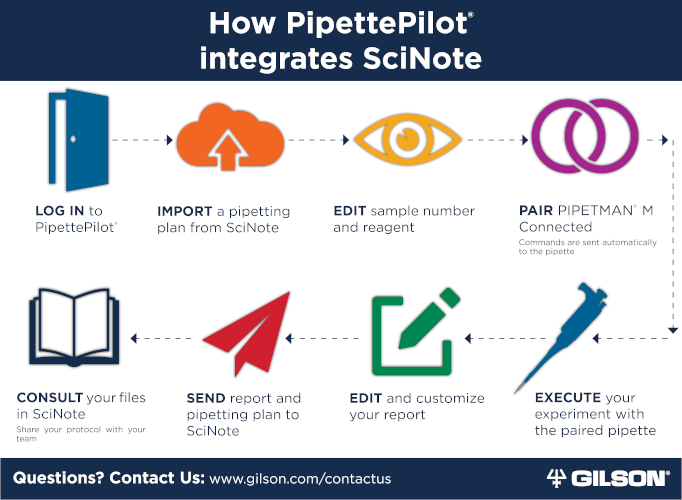
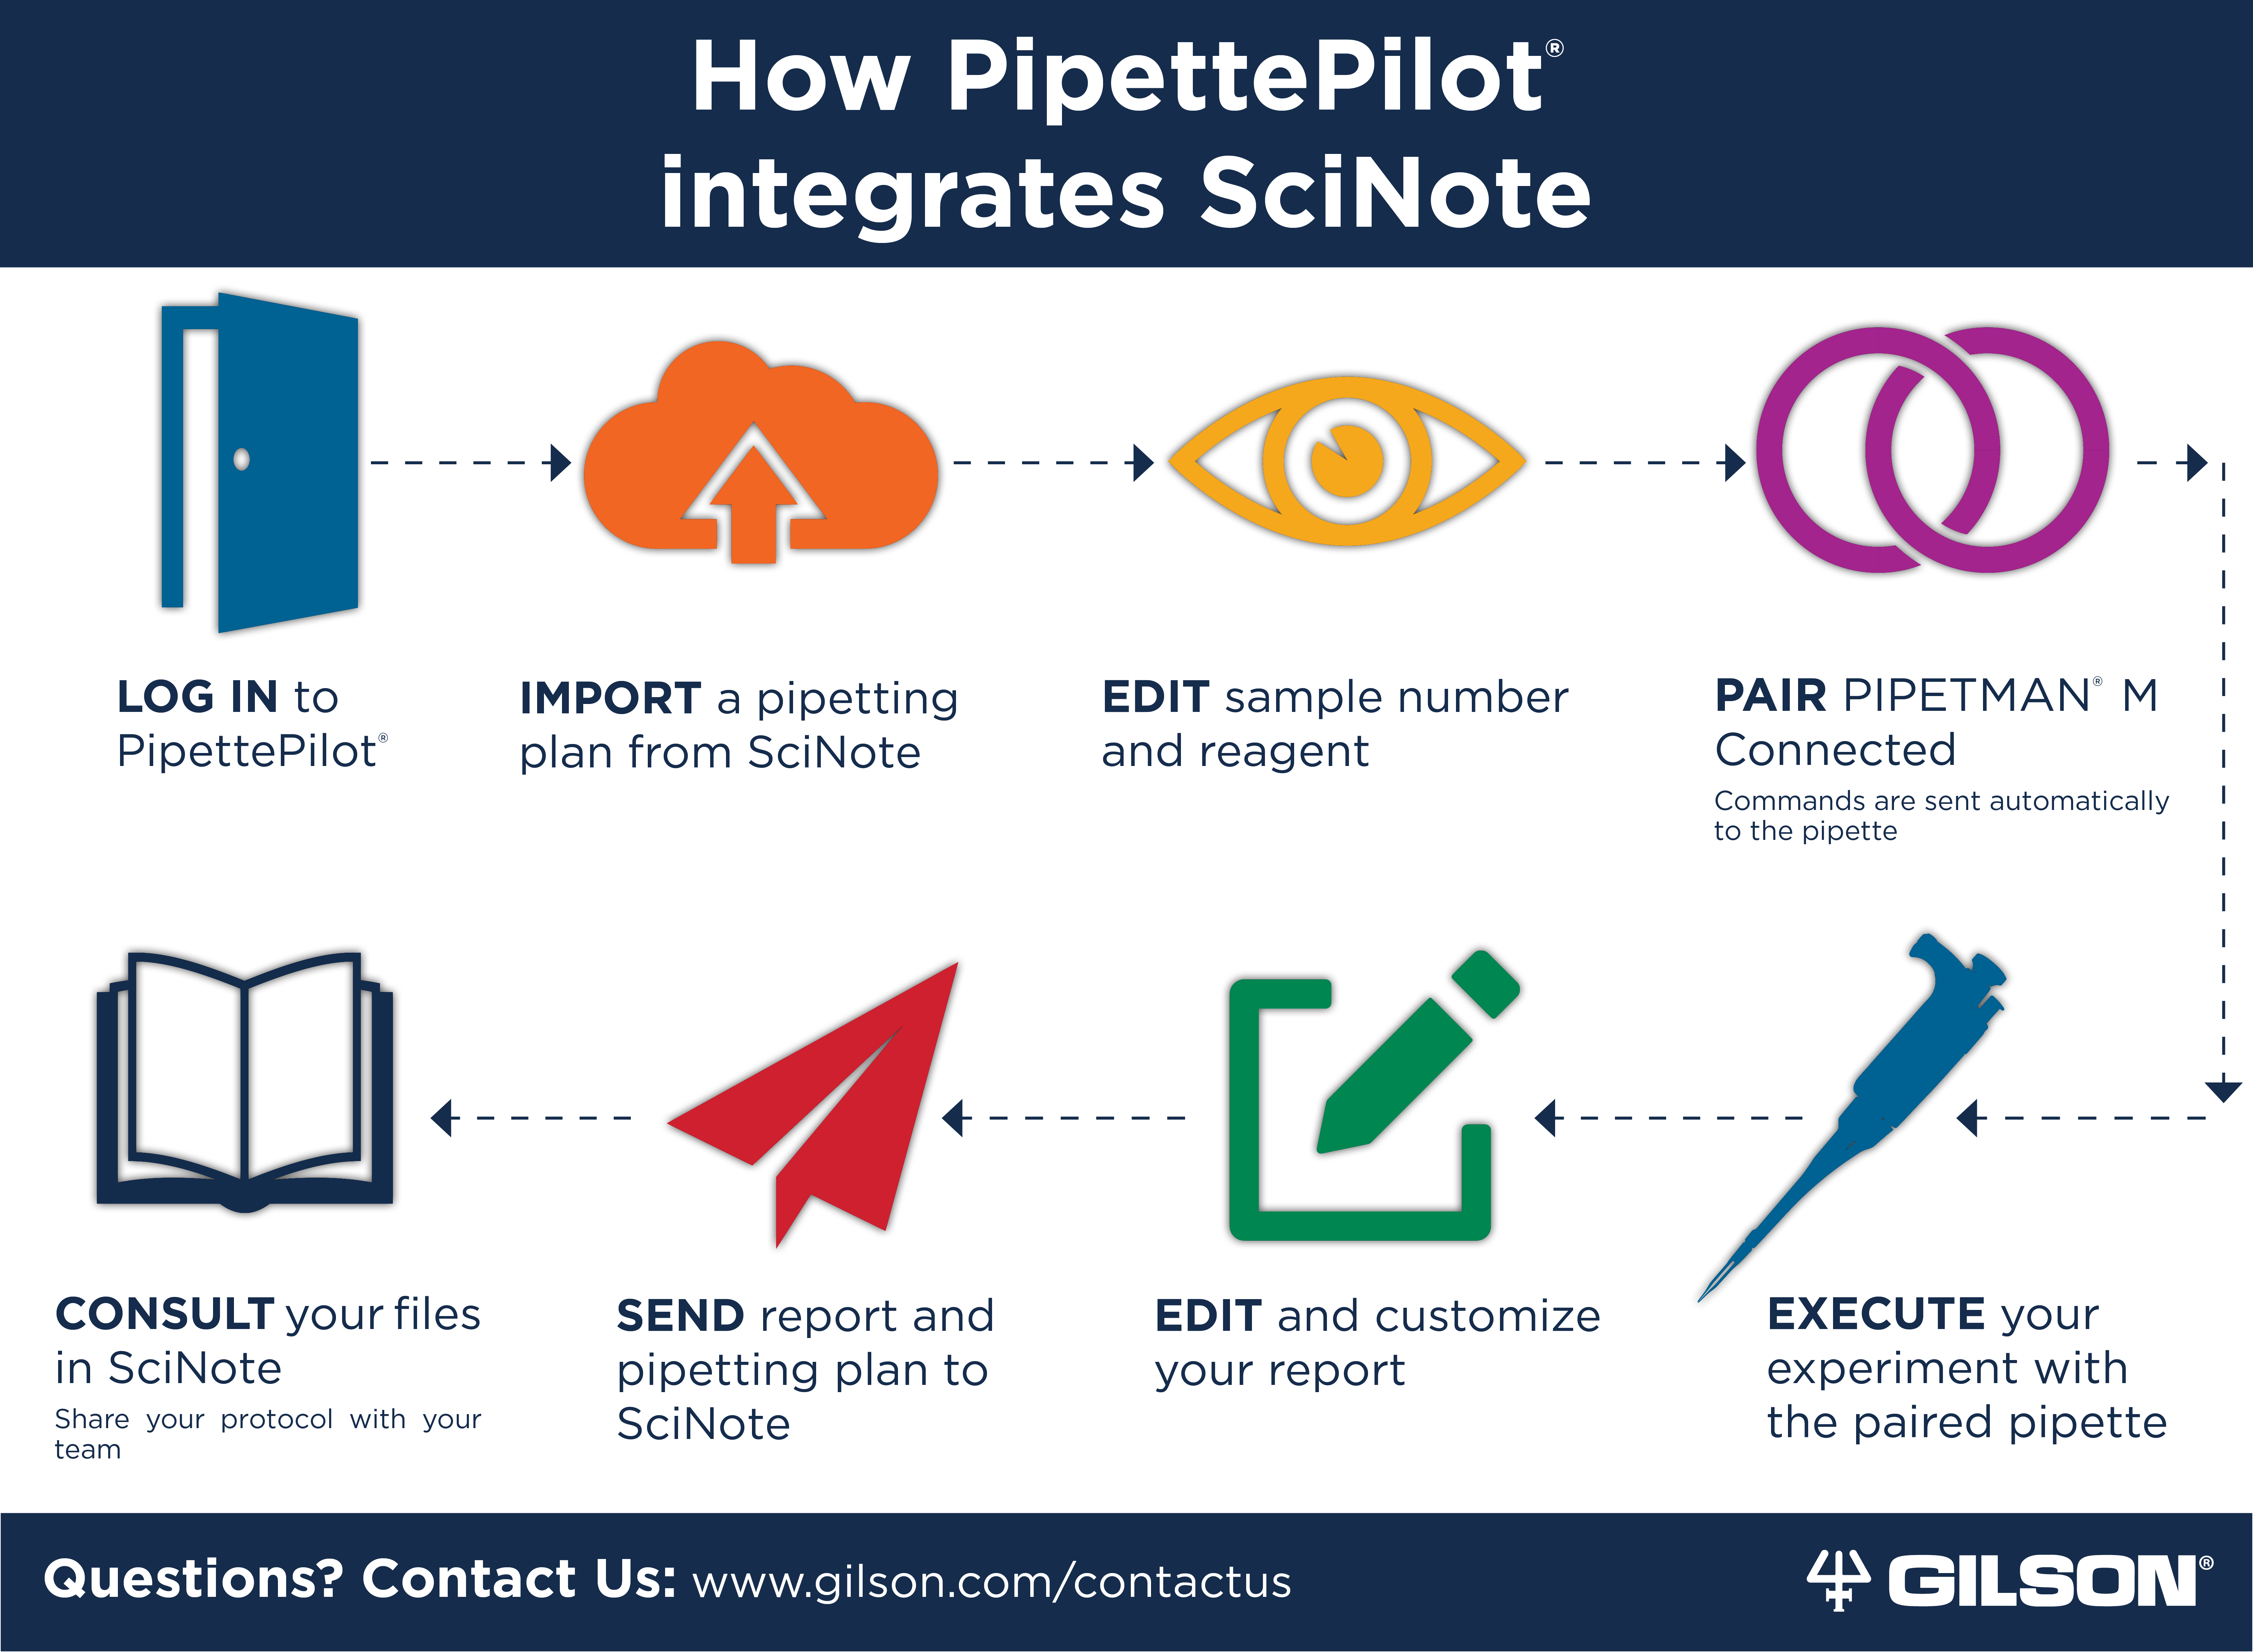
Integrating TRACKMAN Connected Tools with the SciNote ELN
Interested in how you can integrate SciNote into the PipettePilot® app? Download our helpful infographic to learn more.
Language: EN
Download


